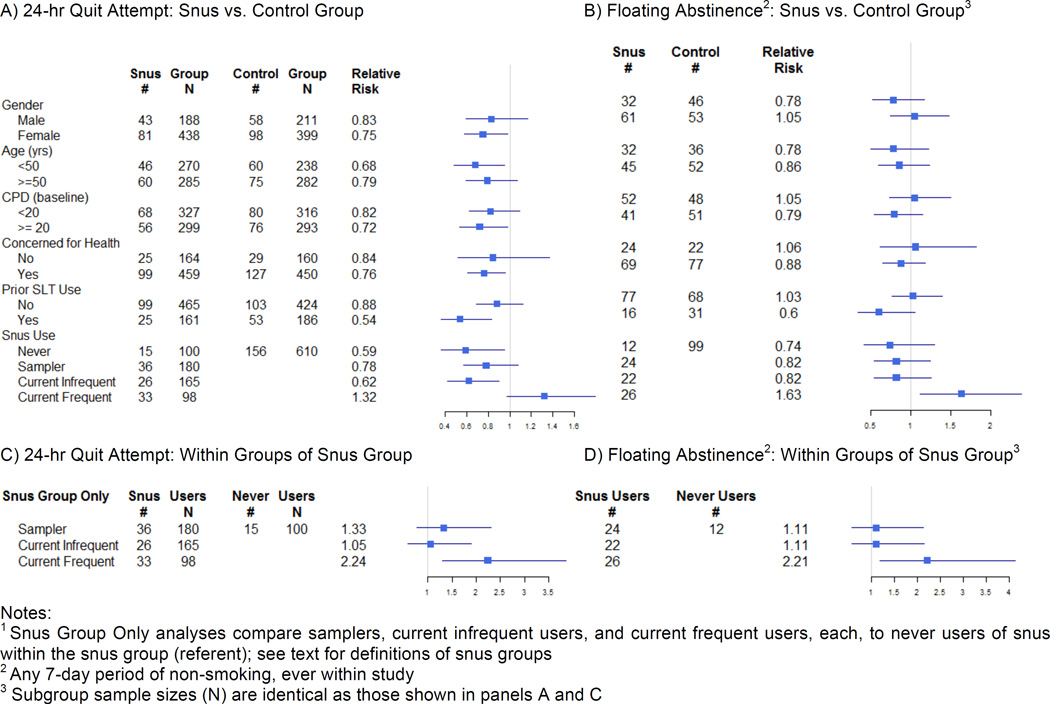
Figure 3.
Subgroup Comparisons for Snus vs. Control Group: A) Incidence of 24-hr, and B) Floating Abstinence, and Within Snus Group Alone1: C) Incidence of 24-hr, and D) Floating Abstinence
Notes:
1 Snus Group Only analyses compare samplers, current infrequent users, and current frequent users, each, to never users of snus within the snus group (referent); see text for definitions of snus groups
2 Any 7-day period of non-smoking, ever within study
3 Subgroup sample sizes (N) are identical as those shown in panels A and C

