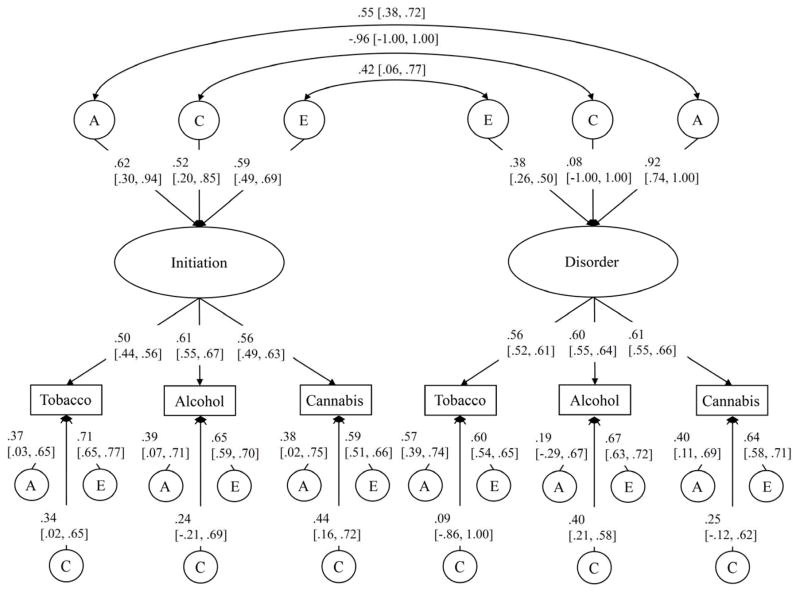
Figure 4.
Standardized parameter estimates for the bivariate factor model for men. The positive correlations between the factors are due to reverse scoring the age of initiation variables. Note that although the shared environmental correlation looks high, it is not statistically significant. 95% confidence limits presented in brackets. A=additive genetic, C=shared environment, E=unique environment. rG=genetic correlation, rC=shared environmental correlation, rE=unique environmental correlation.

