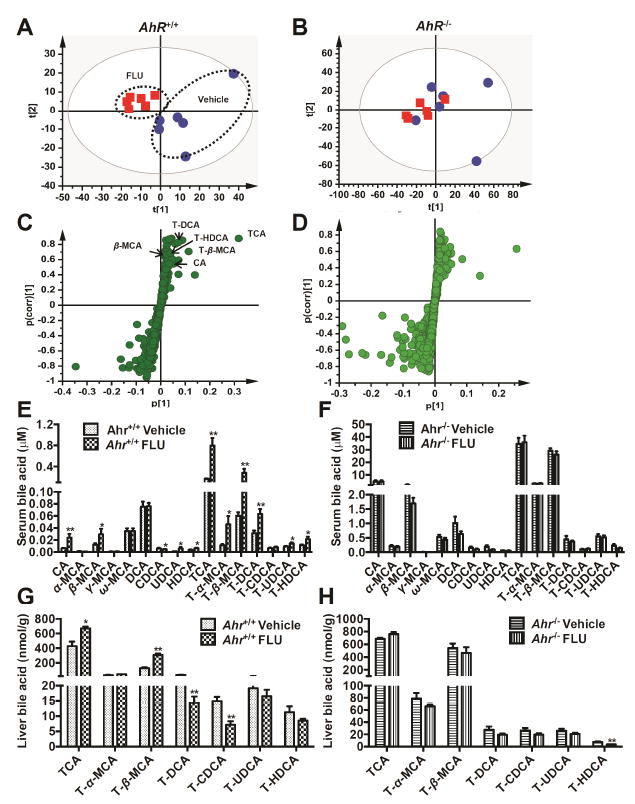
Fig. 6.

Multivariate data analysisand metabolite identification in Ahr+/+ and Ahr-/- mice by using UPLC ESI QTOFMS analysis. Ahr+/+ and Ahr-/- mice were treated with vehicle or FLU (200mg/kg) for 28 days. (A) Scores plot of serum metabolome in WT mice treated with vehicle (
 ) and FLU (
 ) as determined by PCA. (B) Scores plot of serum metabolome in Ahr-/- mice dosed with vehicle (
 ) and FLU (
 ) as determined by PCA. (C) S-plot of OPLS-DA recognized serum metabolome in vehicle- and FLU-treated Ahr+/+ mice, in which identified metabolites were indicated. (D) S-plot of OPLS-DA recognized serum metabolome in vehicle- and FLU-treated Ahr-/- mice. Each point represents an individual mouse serum sample (A, B) and a unique ion (C, D). The t[1] and t[2] represent principal components 1 and 2, respectively. The p(corr)[1] represents the interclass difference, and p[1] represents the relative abundance of the ions. (E-H) Quantitation of bile acids in Ahr+/+ and Ahr-/- mice. (E) Individual bile acids in serum of Ahr+/+ mice. (F) Individual bile acids in serum of Ahr-/- mice. (G) Individual bile acids in livers of Ahr+/+ mice. (H) Individual bile acids in livers of Ahr-/- mice. Data are presented as mean ± SEM; n = 6/group. *P < 0.05, or **P < 0.01, versus vehicle group, by two-tailed Student’s t-test.
