Fig. 7.

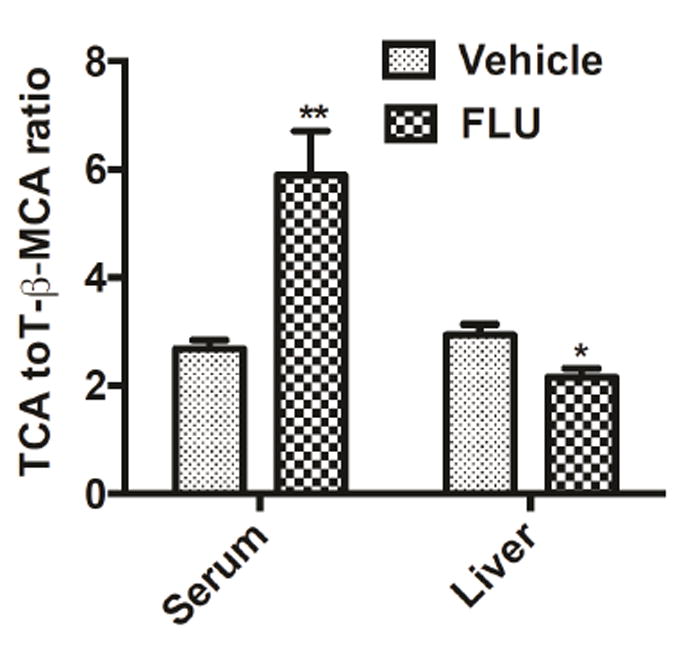
TCA/TβMCA ratios in the serum and livers of mice treated with vehicle or FLU (200 mg/kg) for 28 days. Data are presented as mean ± SEM; n = 6/group. *P < 0.05 versus vehicle group, by two-tailed Student’s t-test.

TCA/TβMCA ratios in the serum and livers of mice treated with vehicle or FLU (200 mg/kg) for 28 days. Data are presented as mean ± SEM; n = 6/group. *P < 0.05 versus vehicle group, by two-tailed Student’s t-test.