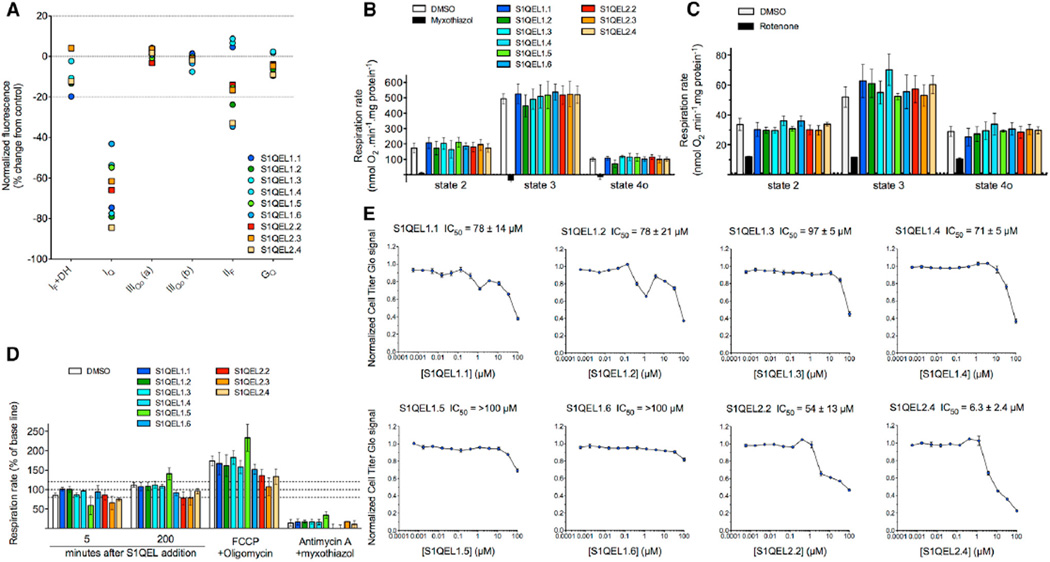
Figure 2. Specificity of S1QELs for Superoxide-H2O2 Production from Site IQ in Isolated Rat Skeletal Muscle Mitochondria without Effects on Oxidative Phosphorylation or Cell Growth.
(A) Effects of 10 µM S1QELs on rates of H2O2 production from different sites measured by Amplex UltraRed assay (normalized to DMSO control as 0% change and the appropriate positive control [Orr et al., 2013, 2015] as −100%). Dotted lines indicate control and ± 20% changes used to assess specificity. Sites IQ, IF+DH, and IIIQo are defined in Figure 1; IIIQo (a), assay at 5 mM succinate; IIIQo (b), assay at 4 mM succinate plus 1 mM malonate; IIF, flavin site of complex II; GQ, ubiquinone-binding site of mitochondrial glycerol 3-phosphate dehydrogenase. Data are from one experiment.
(B and C) Effect of S1QELs on mitochondrial respiration measured in a Seahorse XF24 driven by (B) 5 mM succinate plus 4 µM rotenone with S1QELs added at 10 µM or (C) 5 mM glutamate plus 5 mM malate with S1QELs added at 20 × IC50 against superoxide-H2O2 production by site IQ. Substrate alone (respiratory state 2) was followed by sequential addition of 5 mM ADP (phosphorylating state 3) then 1 µg • ml−1 oligomycin (non-phosphorylating state 4o). DMSO was used as vehicle control. 2 µM myxothiazol (in B) and 4 µM rotenone (in C) were controls for conventional inhibition. Data are means ± SE of n = 3 biological replicates (each comprising three technical replicates). Values with S1QELs were not significantly different from values with DMSO (one-way ANOVA).
(D) Effect of S1QELs on respiration of HEK293 cells in the presence of 4 mM pyruvate, 2 mM glutamine, and 20 mM galactose after acute addition of S1QELs at 20 × IC50 against superoxide-H2O2 production by site IQ. Where indicated, respiration was uncoupled (and ATPase was inhibited) by addition of 0.6 µM FCCP plus 1 µg • ml−1 oligomycin, and non-mitochondrial oxygen consumption was revealed using 4 µM antimycin A plus 4 µM myxothiazol. Data were normalized to baseline in each well before addition of DMSO or S1QEL. Values are means ± SE of three or four biological replicates (each comprising three technical replicates). Dotted lines indicate the normalized baseline rate and ± 20% changes. Values with S1QELs were not significantly different from values with DMSO (one-way ANOVA).
(E) Effect of S1QELs on growth of HEK293T cells cultured in glucose-free DMEM containing 10% v/v fetal bovine serum, 2 mM pyruvate, 2 mM glutamine, and 20 mM galactose. Cell number was assessed after 72 hr as total ATP measured with Cell Titer Glo. The average effect of compounds was normalized to the intraplate median signal and expressed relative to DMSO control = 1.0. Data are means ± SE (n = 3). IC50 values are means ± SD.

