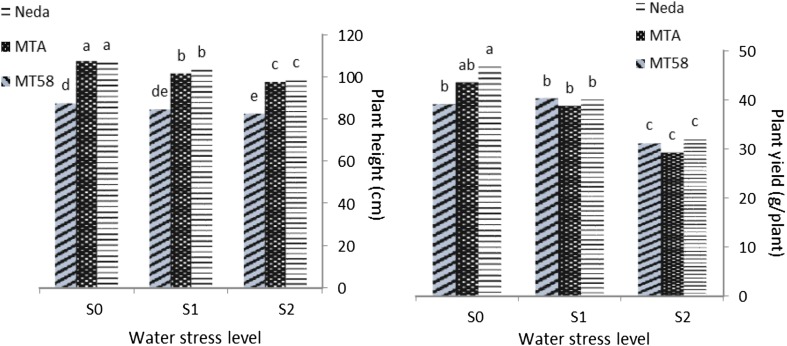
Fig. 2.
Response of studied genotypes to water deficit. Left plant height, right plant yield, S 0 normal irrigation, S 1 1 day irrigation followed by 1 day no irrigation, S 2 1 day irrigation followed by 2 days no irrigation. Columns with common letters have not significant differences at 5 % level of probability

