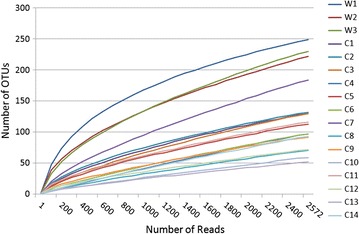
Fig. 1.

Rarefaction curves. Rarefaction curves, calculated at 3 % dissimilarity, compare the number of reads with the number of operational taxonomic units (OTUs) found in the DNA from the fecal matter of wild sables (W 1–3) and housed sables in fur farms (C 1–14)
