Fig. 2.

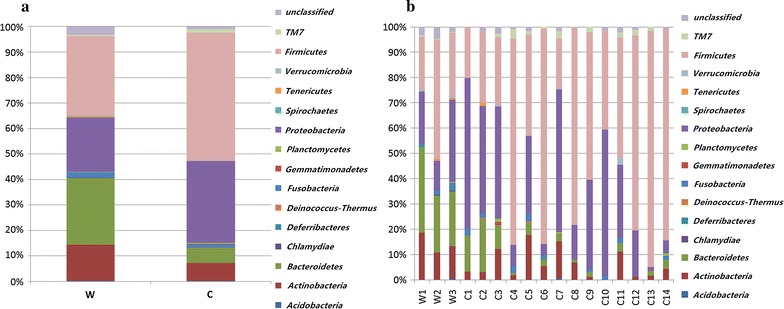
Fecal bacterial population. Overall percentages of bacterial population between two sable groups (a) and within the same group (b) at the phylum level

Fecal bacterial population. Overall percentages of bacterial population between two sable groups (a) and within the same group (b) at the phylum level