
Fig. 4.
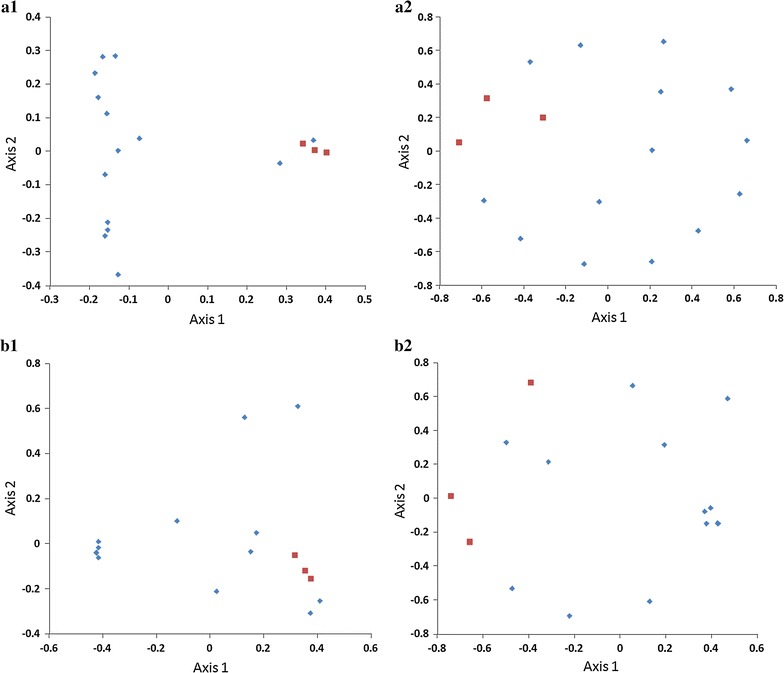
PCoA and NMDS. PCoA (a1 and b1) and NMDS (a2 and b2) correlation analysis of the reads sequenced from the fecal matter of wild sable (red dots) and housed sable (blue dots). a1 and a2 were generated using the Jclass index, b1 and b2 were obtained using YC method