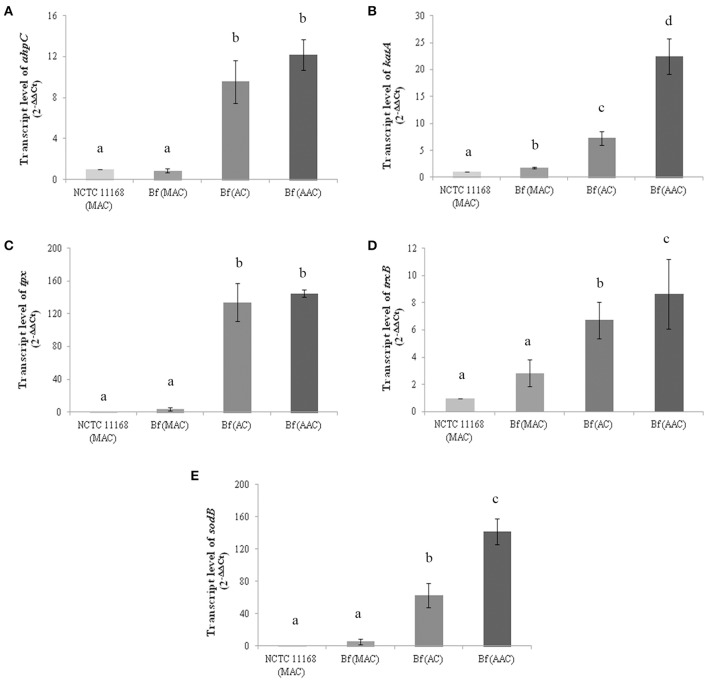
Figure 2.
Transcript levels of ahpC (A), katA (B), tpx (C), trxB (D) and sodB (E) genes in C. jejuni NCTC 11168 and C. jejuni Bf in microaerobic conditions (MAC), aerobic conditions (AC) and after acclimation to aerobic conditions (AAC). Transcript levels were measured by RT-qPCR and calculated using the critical threshold (ΔΔCT) method with rrs gene as the internal control. Results were normalized to the gene transcription of the reference strain C. jejuni NCTC 11168 in microaerobic conditions. Error bars represents the standard deviation of three independent experiments. Significant differences, indicated by a different letter, were determined using the Student's t-test comparisons with a 5% confidence level.

