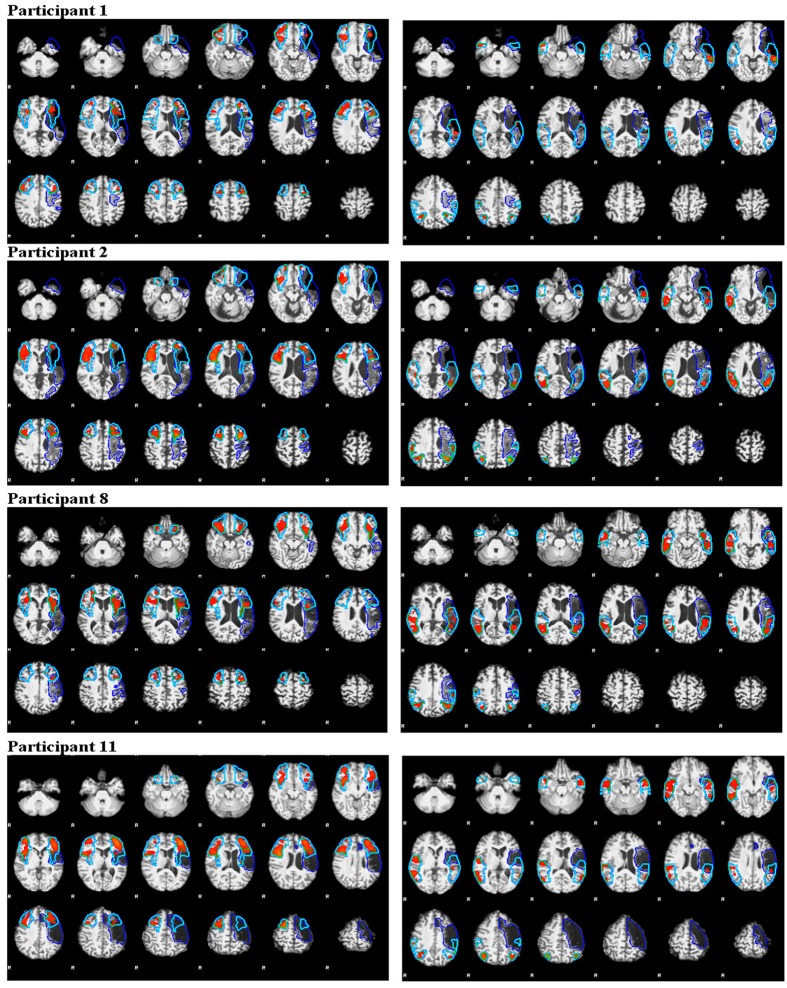
FIGURE 5.
Illustration of activation intensity (median z score) and lesion (dark blue outline) overlap with ROIs (turquoise outline) for participants who demonstrated different language lateralization classifications for the SLI and LALI calculation methods. The anterior ROIs are depicted in the left panels and the posterior in the right panels.

