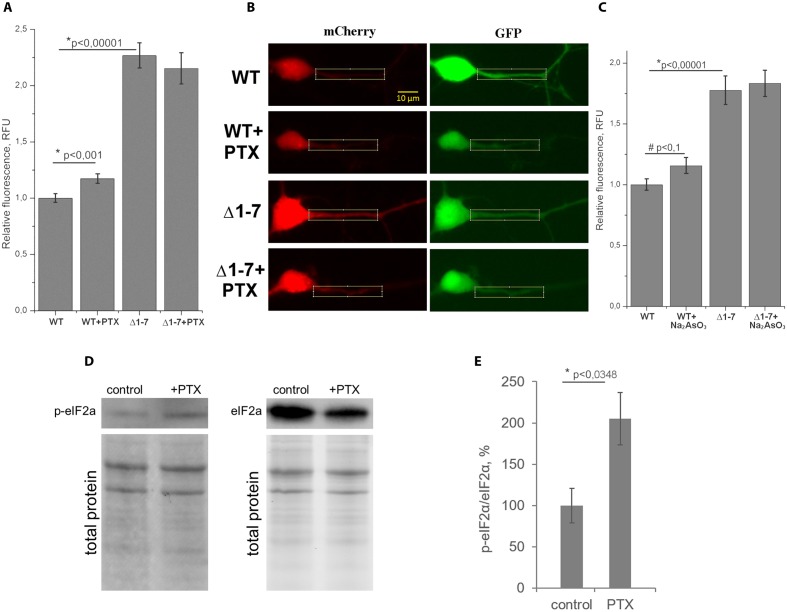
FIGURE 5.
Quantitative analysis of protein synthesis in primary neuron culture. (A) Normalized ratios of mCherry/GFP fluorescence levels in cell cultures transfected by plasmids with wt or Δ1–7 5′UTR of PKMζ in the presence/absence of picrotoxin (PTX). (B) Examples of dendrites used for counting. (C) Normalized ratios of mCherry/GFP fluorescence levels in cell cultures transfected by plasmids with wt or Δ1–7 5′UTR of PKMζ in the presence/absence of Na2AsO3. (D) Western blot analyzes of the primary culture of rat neurons treated/untreated by PTX. Antibodies raised against eIF2α and eIF2αP were used for detection of non-phosphorylated and phosphorylated forms of eIF2α, respectively. (E) Quantitative analysis of the western blots. eIF2a/eIF2aP ratios normalized to total protein (per line). The error bars represent the standard error of mean, (n = 3).

