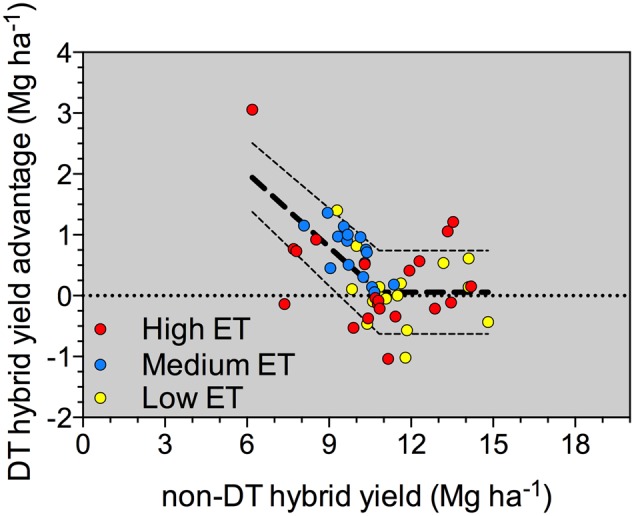
FIGURE 1.

Yield comparison of DT and non-DT hybrid pairs in high (red circles), medium (blue circles), and low (yellow circles) evapotranspiration (ET) environments across several site-years in Kansas for the 2012 and 2013 growing seasons (n = 53). Model: If NDTYLD < 10.82 Mg ha-1, DTYA = 4.45 (+0.41) - 0.405 (+0.0257) × NDTYLD. If NDTYLD ≥ 10.82 Mg ha-1; DTYA = 0.051 (+0.68) Mg ha-1 (+ indicates 95% confidence interval for each parameter); where NDTYLD = non-DT hybrid yield; DTYA = DT Hybrid Yield Advantage; Model probability of greater F < 0.0001; and r2 = 0.36; RMSE = 0.56.
