Figure 3.
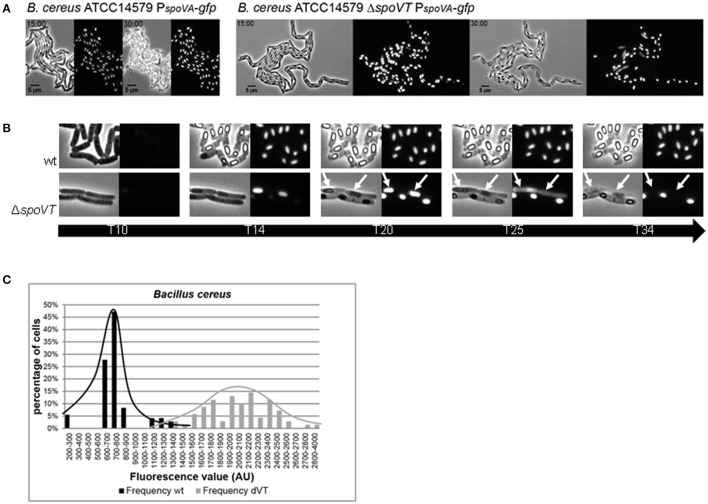
PspoVA promoter activity and signal distribution in a wt and spoVT deletion strain of B. cereus. PspoVA promoter activity was measured in the wild type strain (B. cereus ATCC14579) and a ΔspoVT background using time-lapse microscopy. (A) Two time frames from movies S1 (wt) and S2 (ΔspoVT) show the expression of the PspoVA-gfp fusion during sporulation in individual cells. The time (in hours) is indicated in the top left corner. The scale (in μm) is indicated at the bottom left corner. (B) Cut-outs of individual cells during five different time points (in hours) from Movies S1, S2 are shown to visualize the line of events during sporulation in a wt and a ΔspoVT background. Lysing prespores and mothercells in ΔspoVT are indicated by white arrows. (C) The average fluorescence value distribution in arbitrary units in B. cereus wt (black bars) and spoVT cells (gray bars) calculated from Movies S1, S2.

