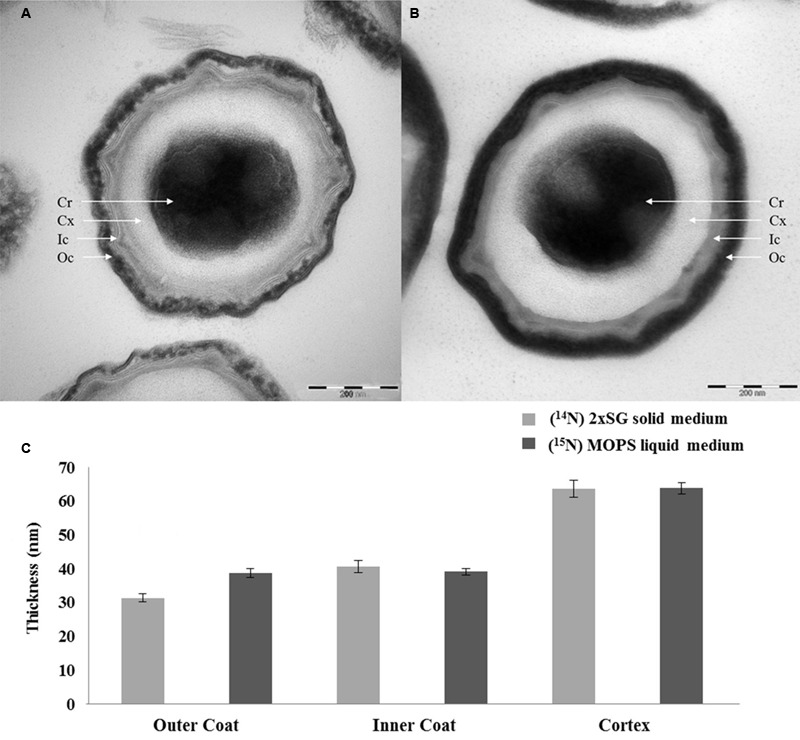
FIGURE 7.

Electron microscopic images of spores developed under solid (A) and liquid (B) medium conditions with the corresponding thickness of the spore coat layers (C). The coat layer thicknesses are averaged over 80 individual spores. The error bars indicate the standard deviations between two biological replicates. By definition, the values are within 95.40% confidence interval in the range of the error bars. Cr, core; Cx, cortex; Ic, inner coat; Oc, outer coat.
