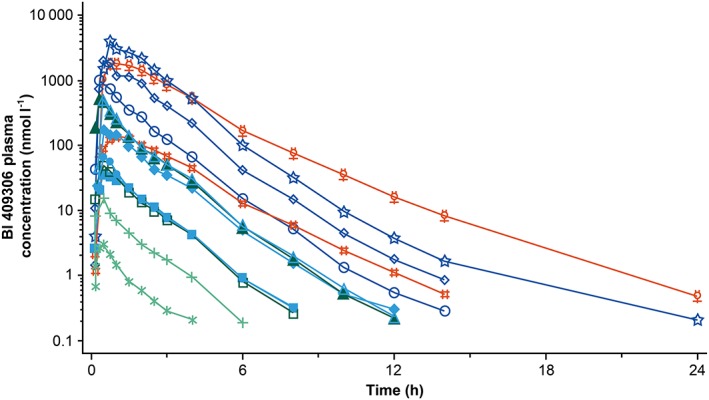
Figure 4.

Geometric mean drug plasma concentration–time profiles after administration of 0.5–350 mg BI 409306 to cytochrome P450 2C19‐genotyped extensive metabolizers and poor metabolizers. EM, extensive metabolizers; PM, poor metabolizers.  0.5 mg solution EM (n = 6),
  5 mg solution EM (n = 6),
  10 mg tablet EM (n = 6),
  50 mg tablet EM (n = 6),
  100 mg tablet EM (n = 5),
  350 mg tablet EM (n = 6),
  100 mg tablet PM (n = 6),
  2 mg solution EM (n = 6),
  5 mg tablet EM (n = 6),
  25 mg tablet EM (n = 6),
  50 mg solution EM (n = 8),
  200 mg tablet EM (n = 6),
  10 mg tablet PM (n = 6)
