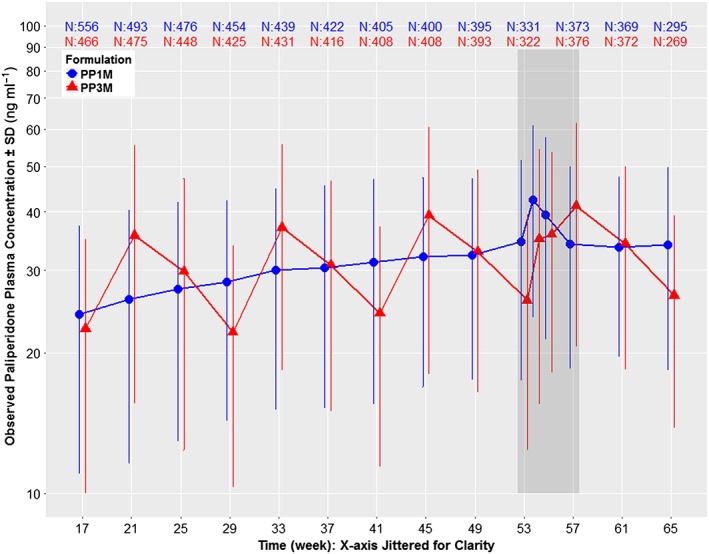
Figure 3.

Dose normalized (100 mg‐eq. for PP1M and 350 mg‐eq. for PP3M) mean ± standard deviation (SD) semi‐logarithmic observed plasma concentration–time profiles of paliperidone comparing PP1M vs. PP3M in Phase III. Data are normalized to 100 mg‐eq. for PP1M and 350 mg‐eq. for PP3M as these two strengths represent the median doses for the two formulations in Phase III. The study design was as follows: open label phase with 150 mg‐eq. PP1M on day 1, 100 mg‐eq. PP1M on day 8, flexible dose of 50, 75, 100 or 150 mg‐eq. PP1M on week 5, week 9 and week 13 based on patient/physician preference, followed by a DB phase starting at week 17 with a fixed dose of PP3M (175, 263, 350 or 525 mg‐eq.) or PP1M (50, 75, 100 or 150 mg‐eq.). Data are presented only for the DB phase since dosing was fixed during this period, which allows dose normalization. The time period indicated by the dark grey shaded area between weeks 53 and 57 represents a phase of semi‐intensive PK sampling around steady‐state. Other than this semi‐intensive period, the PP1M samples were all collected at trough, but PP3M samples were not all trough
