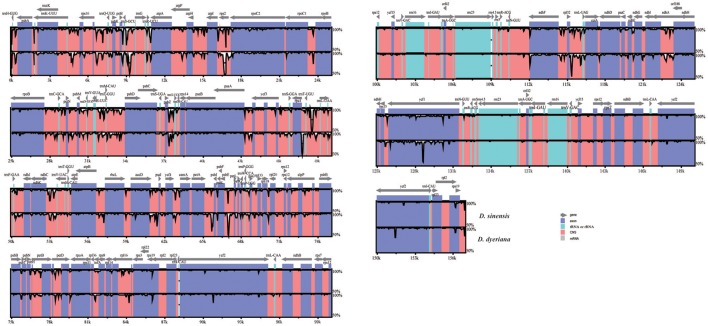
Figure 4.
mVISTA percent identity plot comparing the two Dipteronia plastid genomes with Acer buergerianum subsp. Ningpoense as a reference. The top line shows genes in order (transcriptional direction indicated by arrows). The sequence similarity of the aligned regions between Dipteronia species and Acer buergerianum subsp. Ningpoense is shown as horizontal bars indicating the average percent identity between 50 and 100% (shown on the y-axis of the graph). The x-axis represents the coordinate in the chloroplast genome. Genome regions are color coded as protein-coding (exon), tRNA or rRNA, and conserved noncoding sequences (CNS).

