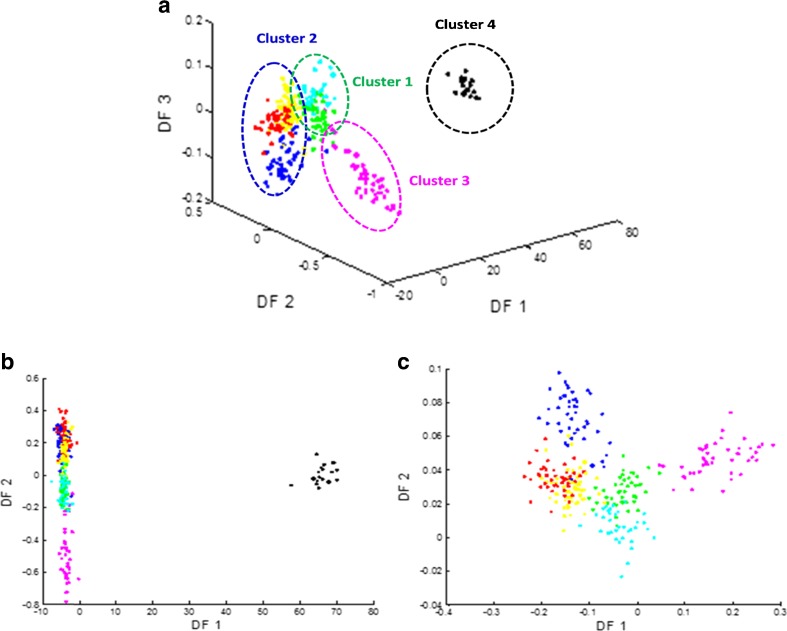
Fig. 2.
DFA scores plots after pre-processing MALDI-TOF-MS data. Different DFA plots were generated for seven species, including: DF1 vs. DF2 vs. DF3 (a); DF1 vs. DF2 (b); and DF1 vs. DF2 (c) of six species, with Br. laterosporus removed. Different colours represent different species. Table 1 details the annotations

