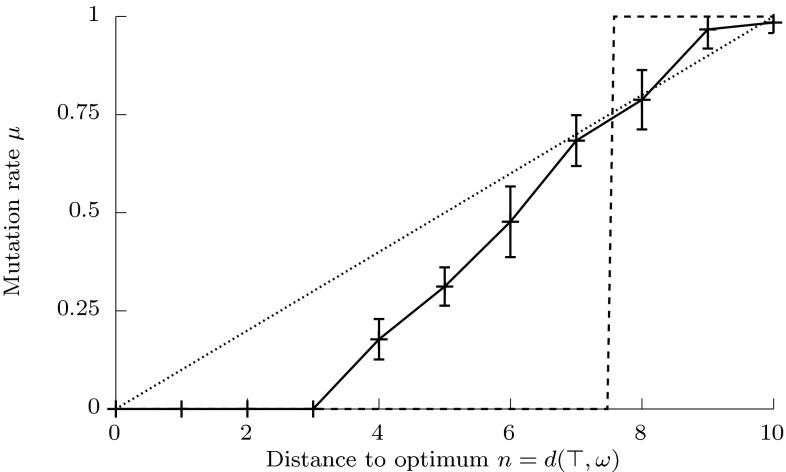
Fig. 4.
Means and standard deviations of mutation rates evolved to minimise expected distance to the optimum in Hamming space after 500 generations. The results are based on 20 runs of the Meta-GA, each evolving mutation rates for generations. Each generation of the Meta-GA involved running the Inner-GAs for 500 generations with 100 individuals. Dashed lines represent theoretical functions optimising short-term (step) and long-term (linear) criteria

