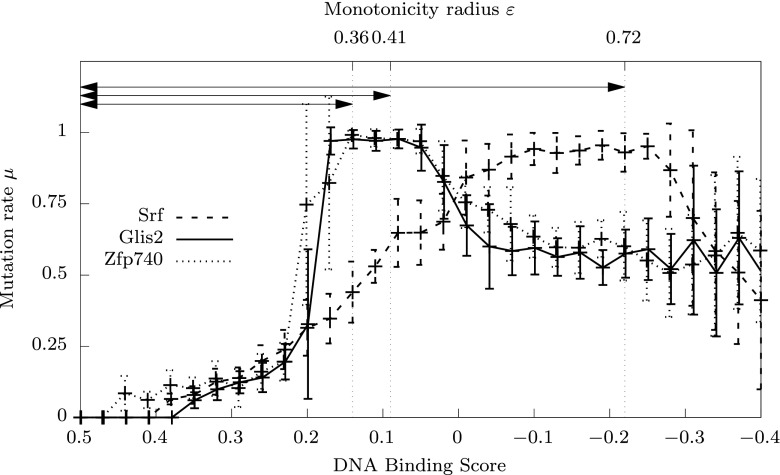
Fig. 6.
Examples of GA-evolved optimal mutation rate control functions. Data are shown for the transcription factors Srf, Glis2 and Zfp740. Each curve represents the average of 16 independently evolved optimal mutation rate functions on a particular transcription factor DNA-binding landscape (Badis et al. 2009). Error bars represent standard deviations from the mean. Similar curves for all 115 landscapes are shown in supplementary Fig. 9. The arrows indicate the monotonicity radius , that defines an interval of fitness values below the maximum, where mutation rate monotonically increases

