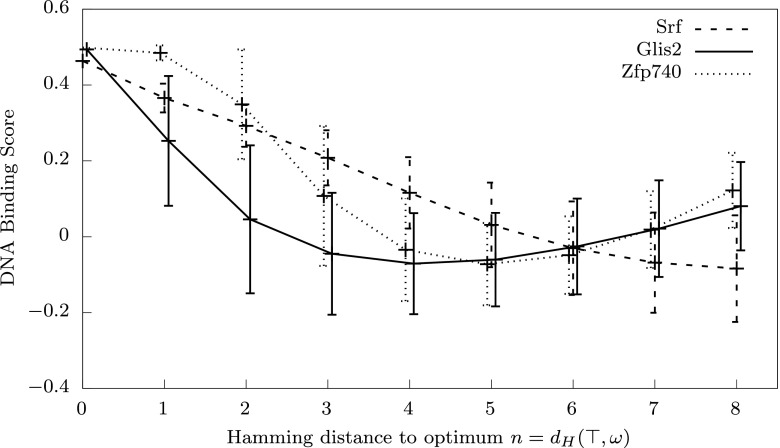
Fig. 7.
Examples of fitness landscapes based on the binding score between DNA sequences and transcription factors (TF) from (Badis et al. 2009). Data are shown for the transcription factors: Srf, Glis2 and Zfp740. Lines connect mean values of the binding score shown as functions of the Hamming distance from the top string (a sequence with the highest DNA-TF binding score). Error bars represent standard deviations. Similar curves for all 115 landscapes are shown in supplementary Fig. 10

