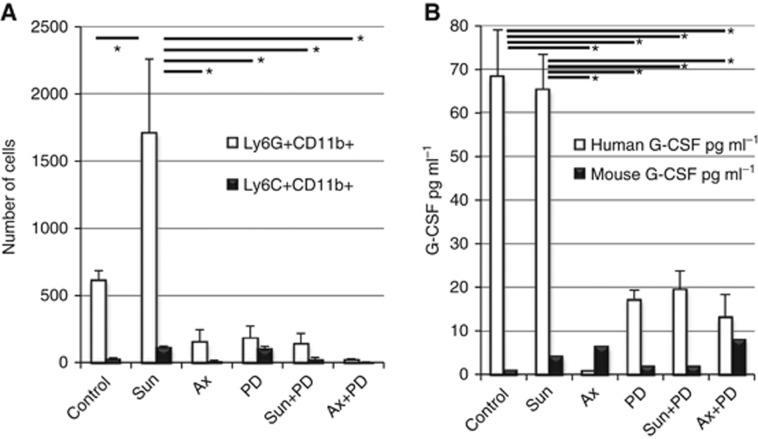
Figure 5.
(A) Enumeration of infiltrating MDSC in tumours harvested after long-term (d62, mean tumour volume=412 mm3) treatment. After digesting tumours, cells were counted and stained with anti-CD11b PE, anti-Ly6G FITC and anti-Ly6C APC antibodies for flow cytometry analysis. The per cent Ly6G+CD11b+ (G-MDSC) and Ly6C+CD11b+ (M-MDSC) cells were then multiplied by the number of viable cells per tumour. Ly6G+CD11b+ were present in vehicle-treated controls and their numbers were increased after tumours became resistant to sunitinib, but decreased after resistance was reversed via MEK inhibition. (B) Intra-tumoural G-CSF levels. Lysates from tumours were analysed by ELISA for levels of both human and murine G-CSF. Frequencies of infiltrating G-MDSC correlated with intra-tumoural levels of human G-CSF. Horizontal bars and * indicate P<0.01 by paired t-test, n=4.

