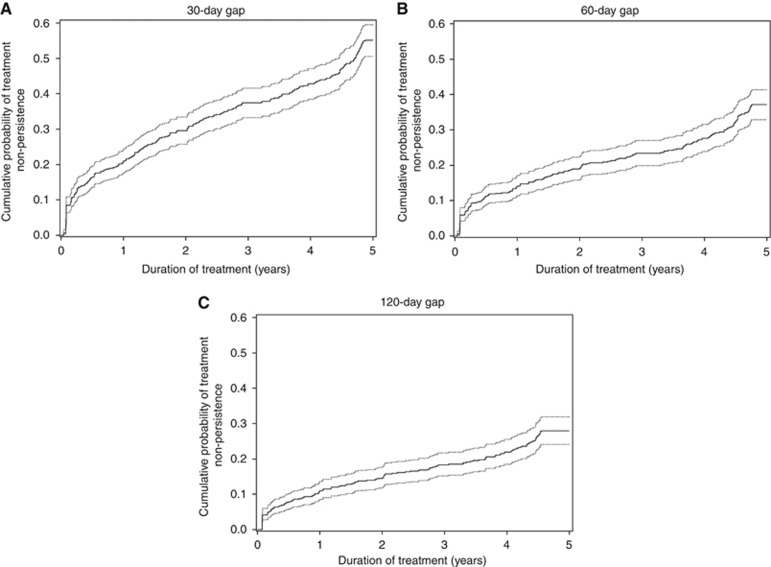
Figure 2.
Cumulative probability of non-persistence curves (continuous line) with 95 % confidence interval (dotted lines) estimated by the Cumulative Incidence Function method during the 5 years following the hormonal therapy initiation for each duration of gaps: a 30-day gap (A), a 60-day gap (B), and a 120-day gap (C). The plateau observed for each curve at the end of the follow up is an artifact that is in relation to the duration of gap retained to define non-persistence.

