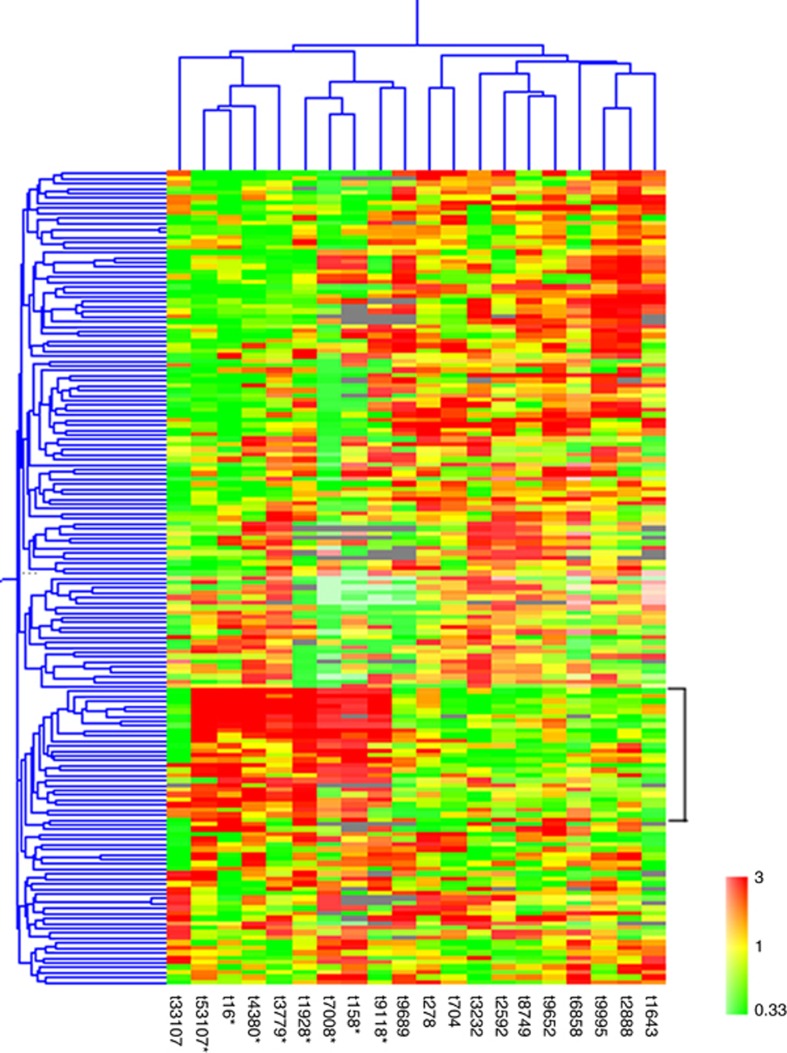
Figure 1.
Two-dimensional cluster analysis of leiomyosarcomas (horizontal) and most varied genes (vertical). Each column corresponds to a tumour and each row corresponds to a gene. Red indicates overexpression, whereas green indicates underexpression. Grey indicates missing or excluded data. Asterisk indicates the tumour belongs to group I in clustering analysis of Figure 2.

