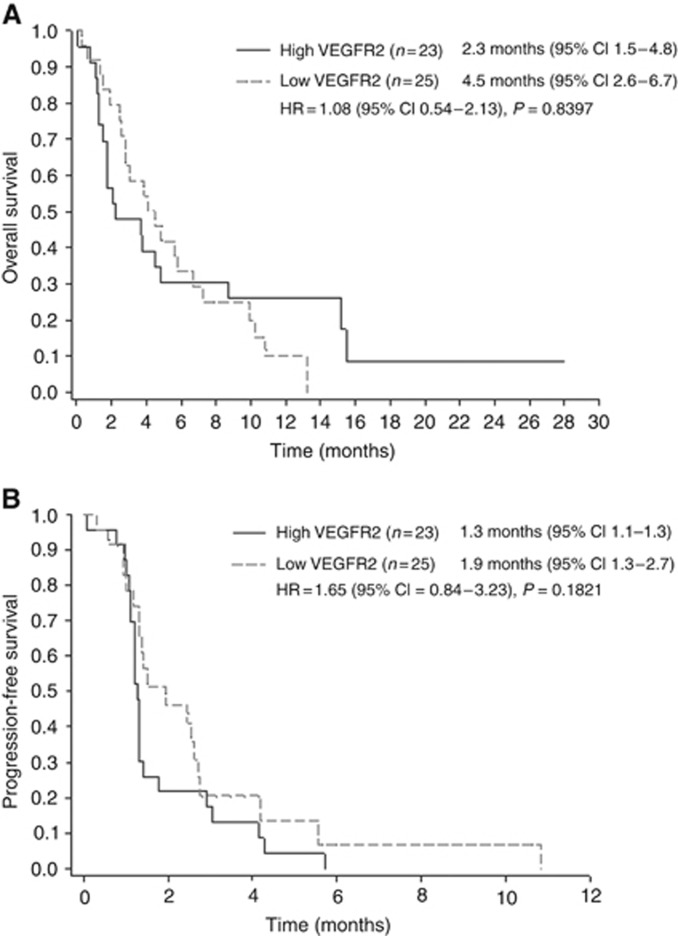
Figure 1.
Kaplan–Meier plot of OS and PFS by high and low VEGFR2 groups in the placebo arm. Patients from the placebo arm with VEGFR2 IHC results from neoplastic vessels were dichotomised into the high and low subgroups, based on their individual VEGFR2 levels relative to the median level for the population (all patients across both arms with available results) (H-score median=35). Kaplan–Meier plots for (A) OS and (B) PFS are shown. Inset tables give median survival times (months) and 95% CIs. Abbreviations: CI, confidence interval; HR, hazard ratio; n, number of patients; VEGFR2, vascular endothelial growth factor receptor 2.

