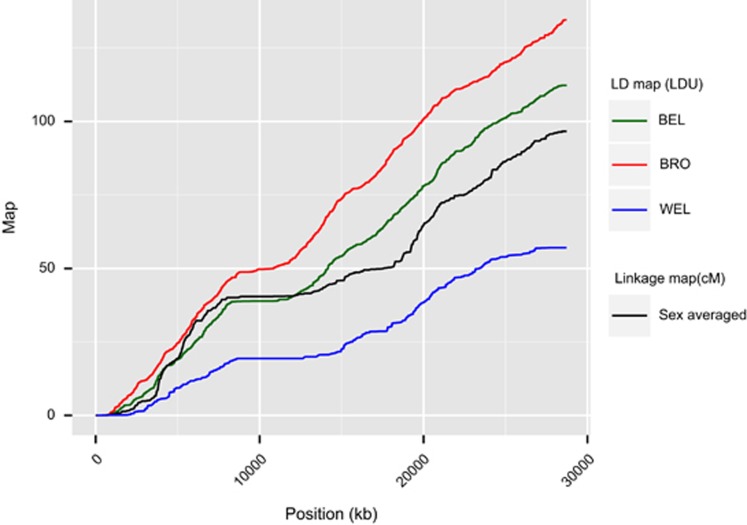
Figure 1.
Linkage and LD maps of GGA8 for all breeds. The broadly analogous structure of the linkage map and LD maps for the three populations can be seen. All maps contain a large plateau of ∼10 000 kb, corresponding to the centromere region. Overall length of the LD maps is inversely related to the strength of LD within a breed. BRO show the lowest LD overall reflecting relatively high haplotype diversity, whereas WEL show strongest LD and lowest population haplotype diversity. Note that there is no expectation that cM and LDU maps be of similar lengths, as the LDU map length is dependent upon population diversity.

