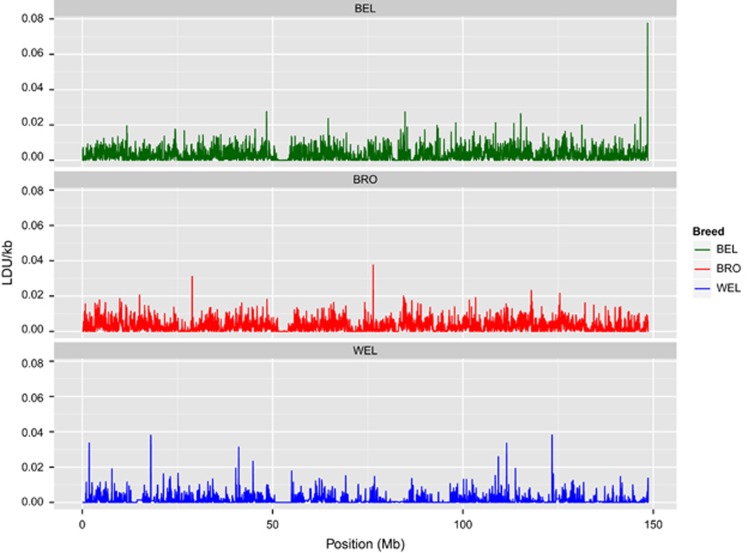
Figure 3.
Comparison of LD breakdown intensity on GGA2 for the three breeds. The LDU/kb ratio is shown for sliding 40 kb windows. A common region of strong LD is shown at ~50 Mb, corresponding to the centromere. There are minimal other trends apparent in the localisation of LD intensities between breeds (ρ<0.21; P<2.2 × 10⁻¹⁶ for all pairwise comparisons).

