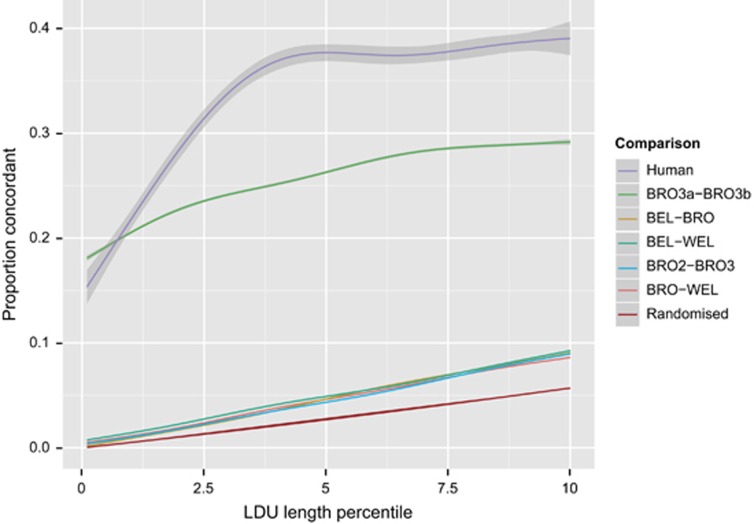
Figure 4.
Pairwise concordance of regions of LD breakdown (indicative of recombination hot spots) between populations. Shown is the proportion of regions in the top n percentile that intersect between the breeds. For pairwise comparisons between BRO/BEL/WEL ~5% of regions in the top 5 percentile are concordant. This proportion is also similar where two separate BRO lines (BRO2/BRO3) are compared. The low level of concordance between regions of LD breakdown, even between lines within breed, suggests there may be marked differences in haplotype structure as regions of LD breakdown align with increased haplotype diversity (Daly et al., 2001). When the largest population is bisected (BRO3a/b), this proportion is ~27%, still far lower than the equivalent comparison between European and African human populations (Pengelly et al., 2015). All comparisons show a greater proportion of concordance than the randomised data set, showing that the patterns are not wholly stochastic. Shaded regions indicate 95% confidence intervals of the trendlines, and concordance was calculated for 0.1% increments.

