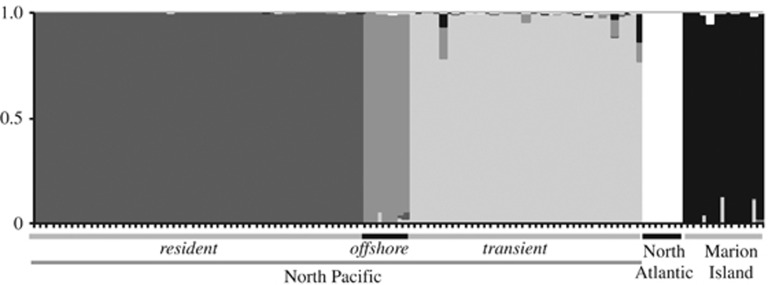
Figure 2.
Population structure for a data set of 115 killer whales at k=5, as estimated by STRUCTURE 2.3.4. Each individual is represented by a column and the probability of that individual belonging to each population is indicated by coloured segments. The plot is based on the highest likelihood run (of five).

