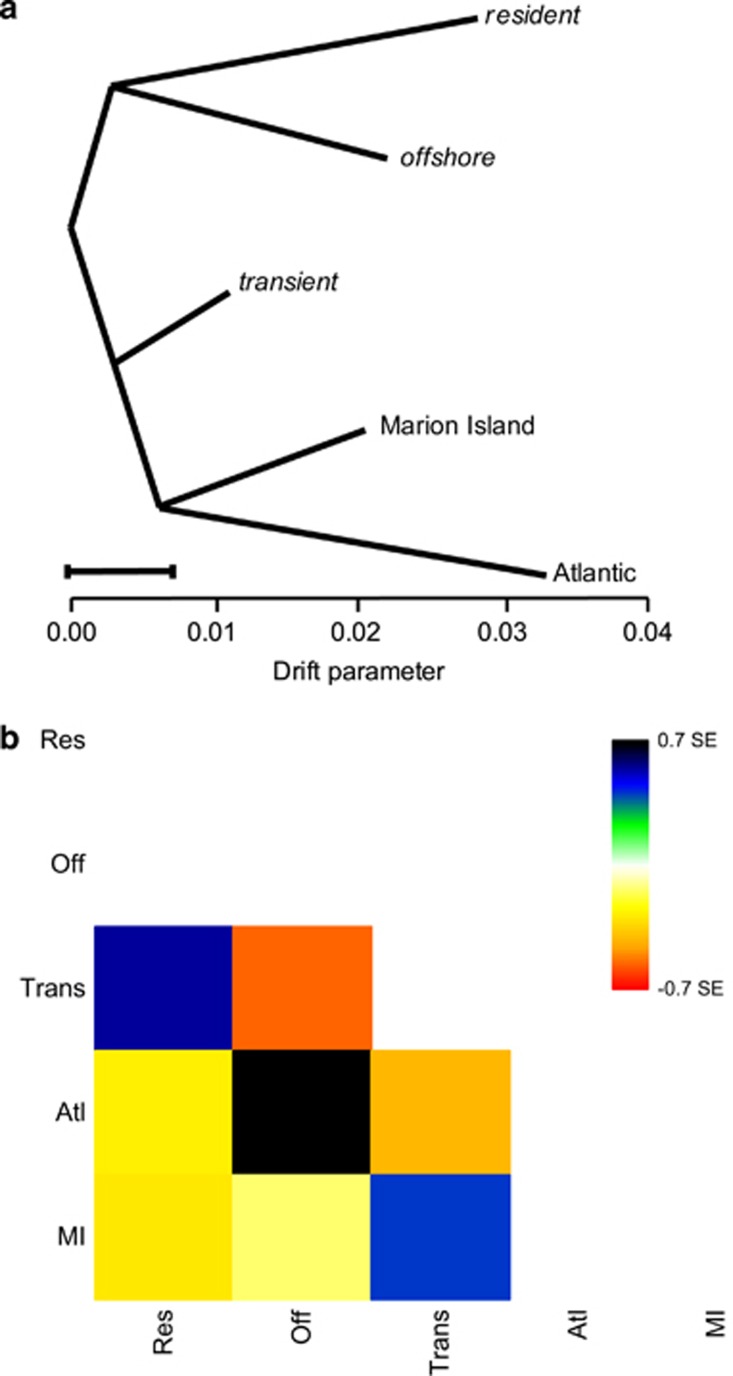
Figure 3.
(a) TreeMix graph visualising the relationship among populations as a bifurcating maximum-likelihood tree. Horizontal branch lengths are proportional to the amount of genetic drift that has occurred along that branch. The scale bar shows 10 times the average s.e. of the entries in the sample covariance matrix. (b) Residual fit of the observed versus predicted squared allele frequency difference, expressed as the number of s.e. of the deviation. Colours are in the palette on the right. Residuals above zero represent populations that are more closely related to each other in the data than in the best-fit tree, and are candidates for admixture. Negative residuals indicate that a pair of populations are less closely related, based on the data, than represented in the best-fit tree.

