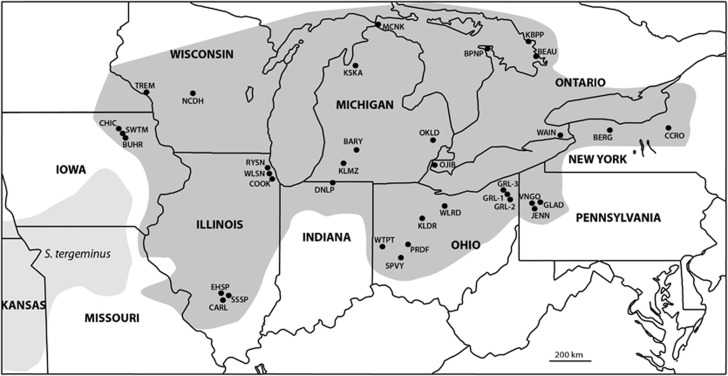
Figure 1.
Map of sampling locations for S. catenatus samples (darker shading) and S. tergeminus samples (lighter shading). Populations are indicated with smaller bold font, and state or province names are indicated with larger bold font. See Table 1 for population abbreviations and sample sizes.

