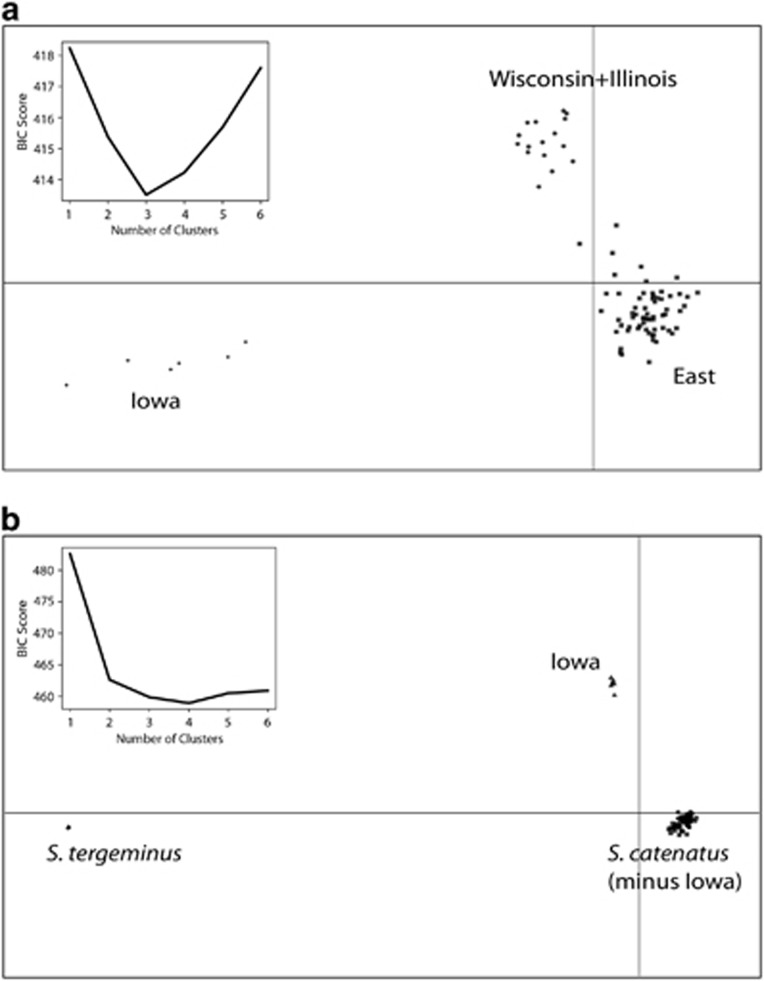
Figure 4.
Results from clustering analyses in adegenet with S. catenatus samples only (a), and with the outgroup S. tergeminus included (b). Main plots show results of discriminant analysis of principal components for the optimal K value inferred from Bayesian information criterion (BIC; top left insets). Within S. catenatus, the greatest separation in discriminant function space was observed between the Iowa samples and all the remaining S. catenatus samples from east of the Mississippi River.

