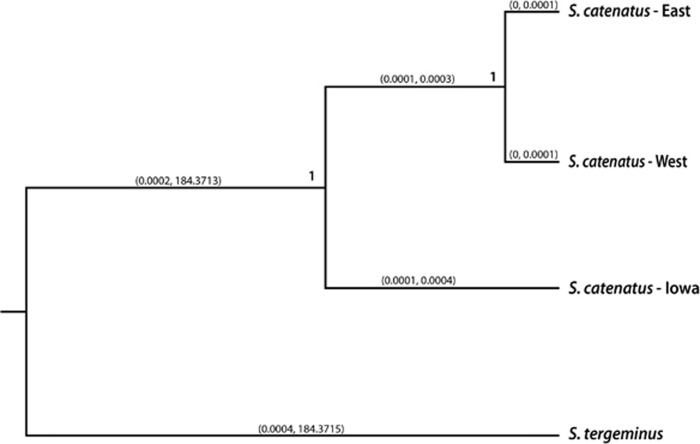
Figure 5.
Tree summarizing results from the 10 SNAPP runs that each included different subsets of samples. Values at nodes represent posterior support for clades after the first 20% of trees were removed as burn-in (topologies and clade support values were the same across all 10 runs). Values on the branches represent the minimum and maximum values observed in the set of 95% highest probability density (HPD) values for branch length across the 10 runs. Lower bounds of the branch lengths separating Iowa from the remaining S. catenatus do not include zero, supporting the presence of significant phylogenetic divergence between Iowa and other S. catenatus populations.

