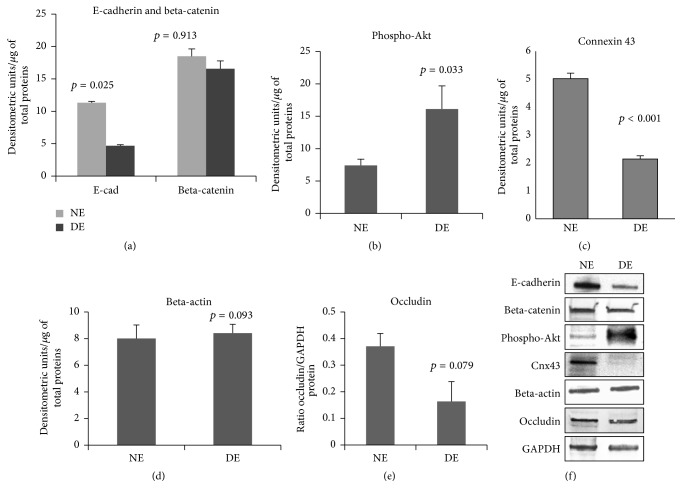
Figure 4.
Western blot analysis of E-cadherin and beta-catenin (a); phospho-Akt (b), Cnx43 (c), beta-actin (d), and occludin (e) levels. Beta-actin and GAPDH (f) were used for loading control. NE: rabbit healthy epithalial cells. DE: LSCD's epithelium 3 months after limbectomy E-cadherin levels decreased significantly in the LSCD cornea while phosph-Akt levels were increased.

