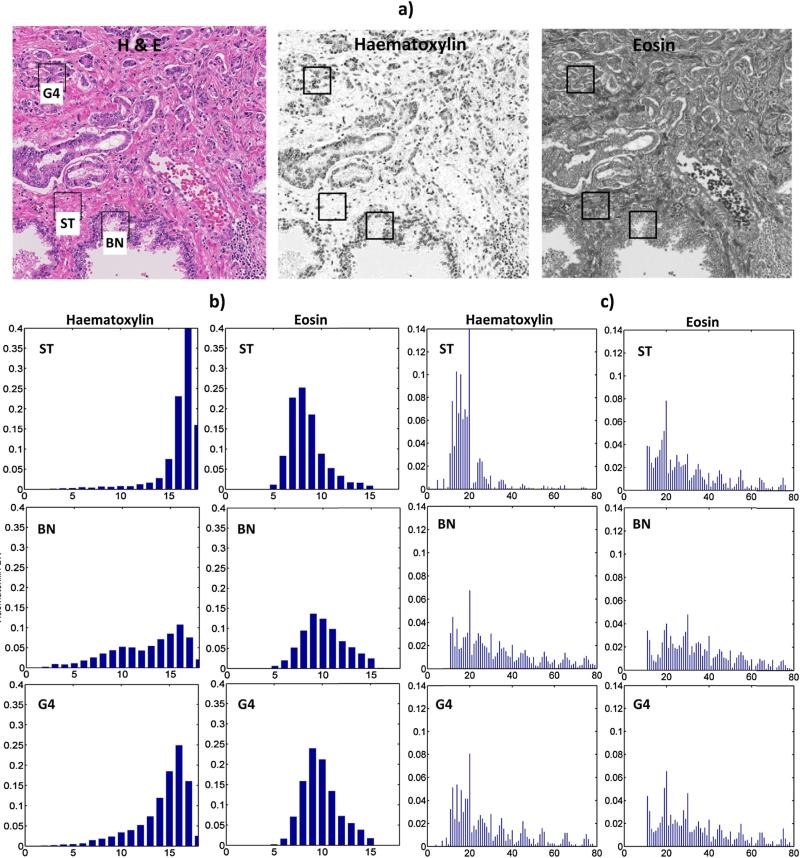
Fig. 3.
Examples of intensity and texture pixel descriptors from deconvoluted H&E images of prostate cancer tissue: (a) original image with deconvoluted components, (b) pixel intensity histograms and (c) × VARP=8,R=1 histograms, representing the image texture. Boxes in (a) indicate locations of windows W (size of window: N = 64 pixels) from which the descriptors were extracted. Histograms from windows in areas of stroma (ST), benign/normal epithelium (BN) and cancer Gleason pattern 4 (G4) are shown in (b) and (c). Note, that background or luminal pixels found in H&E image are masked out and do not contribute to the histogram calculation. Histograms in (b) have 18 bins to map 0–255 gray level intensity range (x-axes), whereas in (c) 80 bins are used to represent the distribution of local binary patterns (LBP) from low (bins 0–40) and high (bins 41–80) contrast image regions. Y-axes are the normalized density of pixels in each histogram bin.

