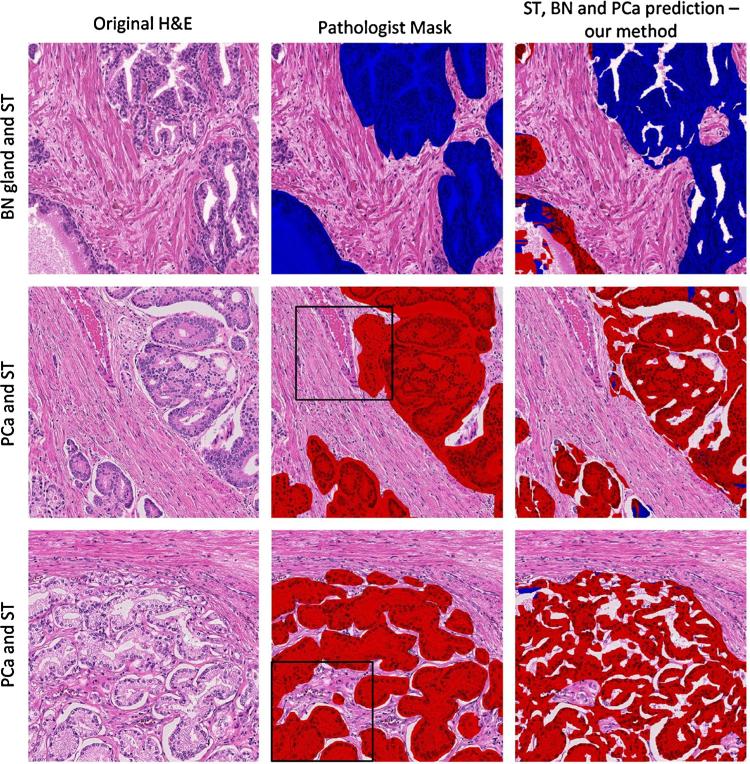
Fig. 7.
Classification of glandular areas from benign/normal glands and prostate cancer using the random forest (RF) classifier. Original H + E images in column 1 of a representative area of benign/normal glands (BN) and stroma (ST) (row 1) and 2 different areas of prostate cancer PCa Gleason pattern 4 (rows 2 and 3). The annotation of the pathologist in column 2 is compared to the annotation with the RF classifier in column 3. The areas marked with black squares are identical to the ones analyzed in Fig. 6. The epithelium was classified as BN or PCa using a descriptor formed by Hist(H), Hist(E), (H), (E) with P = 24 and R = 3.

