
Figure 4.
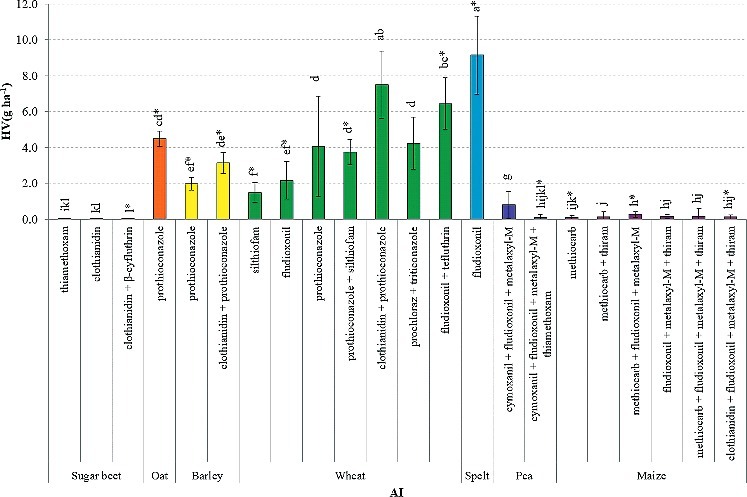
Heubach values (mean ± SD), expressed as g ha−1, of the different AI combinations. Different superscripts denote statistical significance at P < 0.05. Bars with an asterisk comprise of only one seed sample.
Official websites use .gov
A
.gov website belongs to an official
government organization in the United States.
Secure .gov websites use HTTPS
A lock (
) or https:// means you've safely
connected to the .gov website. Share sensitive
information only on official, secure websites.
Heubach values (mean ± SD), expressed as g ha−1, of the different AI combinations. Different superscripts denote statistical significance at P < 0.05. Bars with an asterisk comprise of only one seed sample.