
Figure 1.
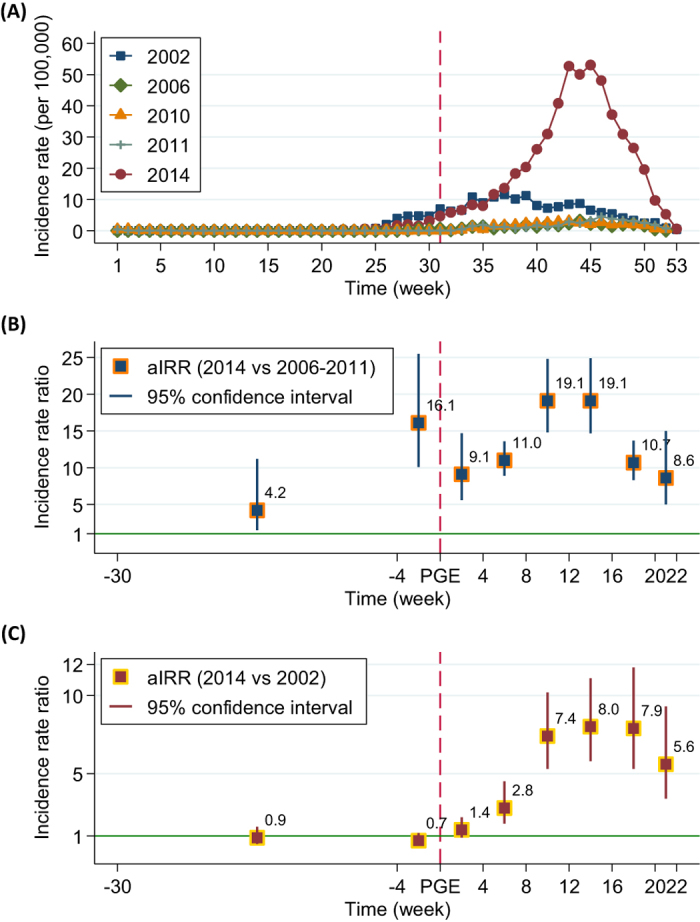
Distributions of weekly dengue incidences (100,000−1) in large-scale (2002 and 2014) and moderate-scale (2006, 2010 and 2011) outbreak years (A), and adjusted incidence rate ratios (aIRR) of dengue for the periods before and after petrochemical gas explosion (PGE) occurred at the 31th week (shown in a red dashed line), compared 2014 with 2006 + 2010 + 2011 (B) and with 2002 (C), Kaohsiung, Taiwan. Note: aIRRs were adjusted for maximum, minimum, average temperatures, relative humidity, rainfall and the percentage of Breteau index level >2 in a month.