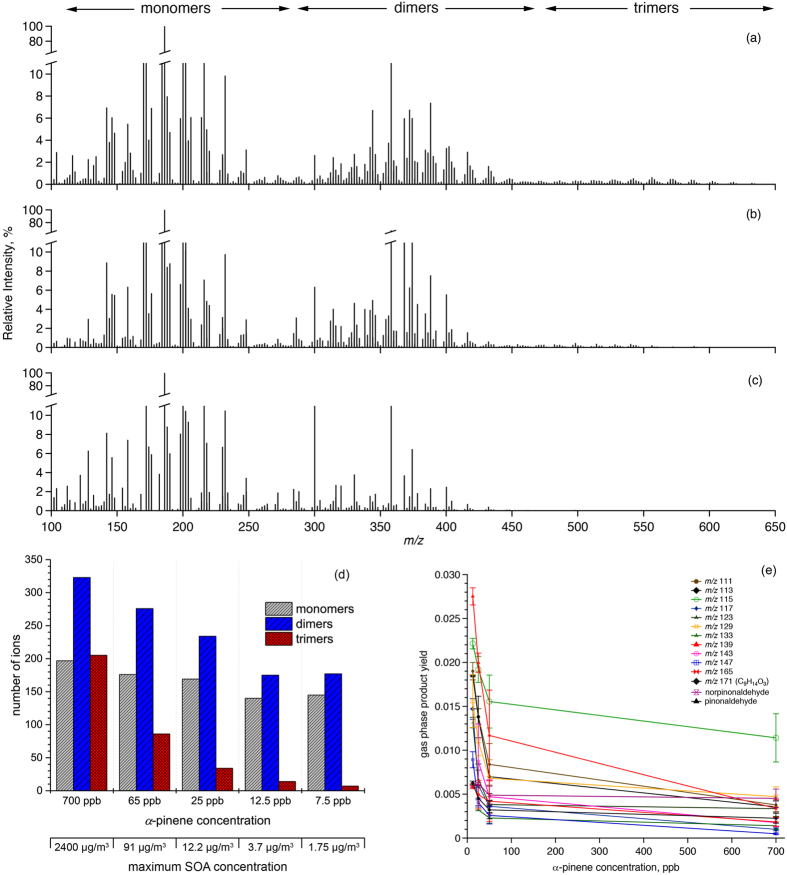
Figure 2.
Mass spectra of SOA generated from α-pinene ozonolysis in an atmospheric simulation chamber with initial α-pinene concentrations of (a) 700 ppb, (b) 65 ppb and (c) 7.5 ppb. Note that relative intensity scales are shown up to 10%. Several monomers and a few dimers have intensities >10%. (d) The number of monomers stays relatively constant over all α-pinene and SOA mass concentrations (150 to 200 ions) while the number of peaks in the dimer mass region decreases by almost a factor of two and trimers decrease by more than a factor of ten and are essentially not formed under conditions relevant for the ambient atmosphere (7.5 ppb). (e) Gas phase product yields (defined as concentration of oxidation product divided by the starting concentration of α-pinene) for seven volatile oxidation products of α-pinene. Yields decrease with increasing α-pinene starting concentration indicating that the species partition increasingly into the particle phase with higher SOA concentrations.

