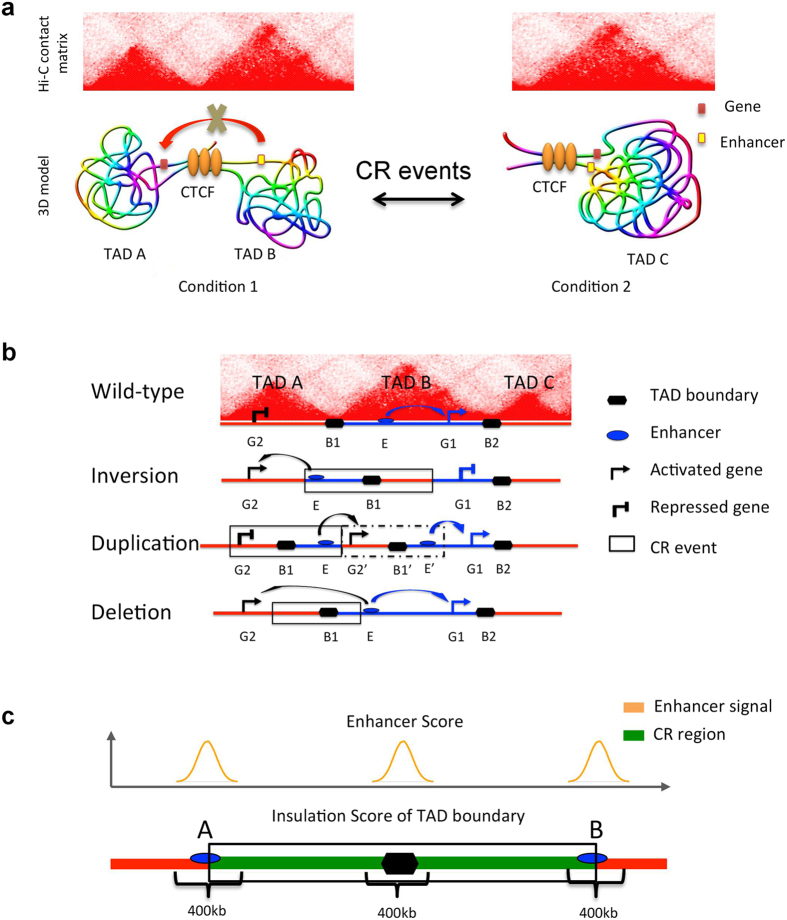
Figure 1. Models for how CR events cause Chromosome 3D structure variation.
(a) A model of chromatin TAD variation caused by CR. In the Hi-C contact matrix, every red triangle represents one TAD. (b) A model for pathogenicity of CR events that alter gene expression through 3D chromosome structure (adapted from ref. 18). (c) The scores used to predict disease-associated CR events that affect TADs. SI Score = Percentile (Insulation Score) * Percentile (Enhancer Score).

