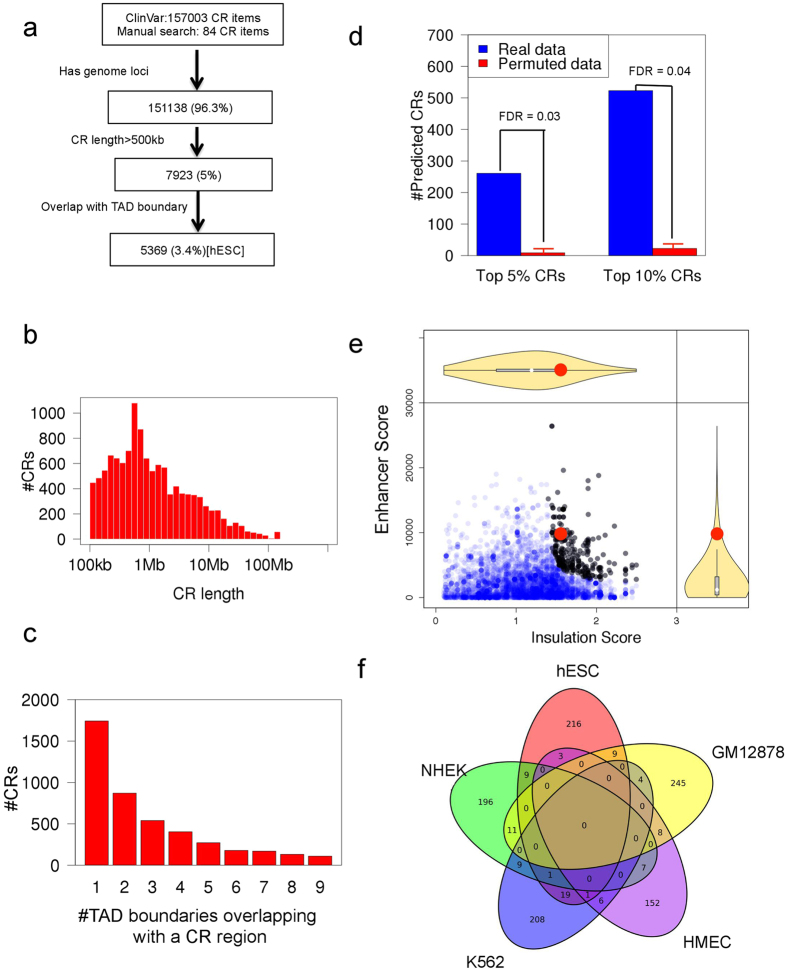
Figure 2. Predicting disease-associated CR events that affect TADs.
(a) The CR-filtering workflow. (b) The length distribution of the filtered CR regions. (c) The number of CRs with different number of overlapping TAD boundaries. (d) The FDR of the top predicted CRs. (e) The scatterplot of Insulation Score vs. Enhancer Score. Black points represent the CR events with top 5% highest SI score. The red point represents a CR associated with polydactyly disease. (f) The overlap between top 5% predicted CRs using different cell lines.

