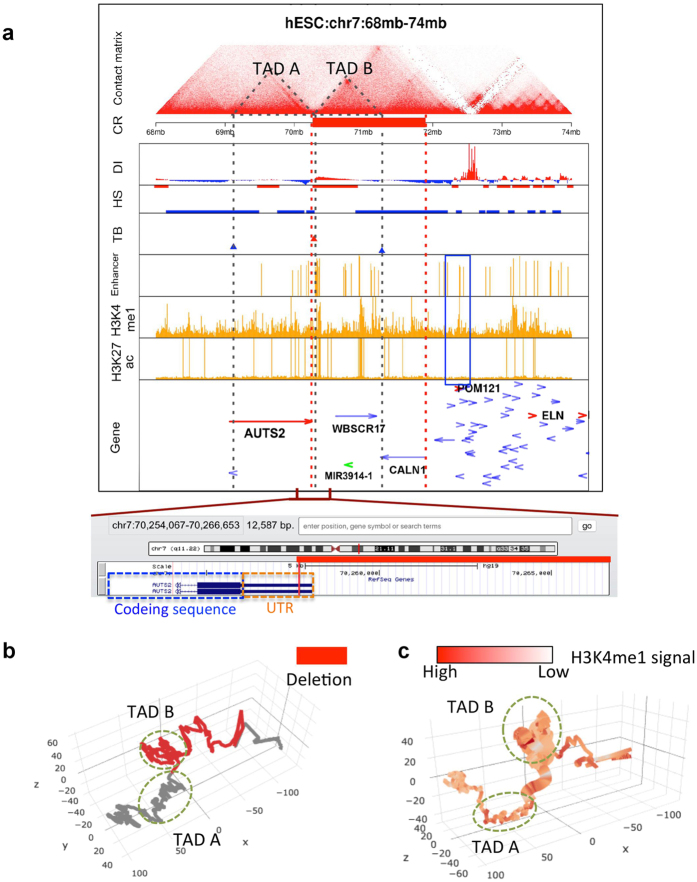
Figure 4. Visualization of the relationship between TADs and a deletion CR associated with intellectual disability disease.
(a) Similar plot to Fig. 3a for a deletion CR. The detailed information of the deletion region and nearby genes is added to the bottom. (b,c) The 3D model of the TADs surrounding the deletion region. The red bar in b and thick bar in c represent the CR region.

