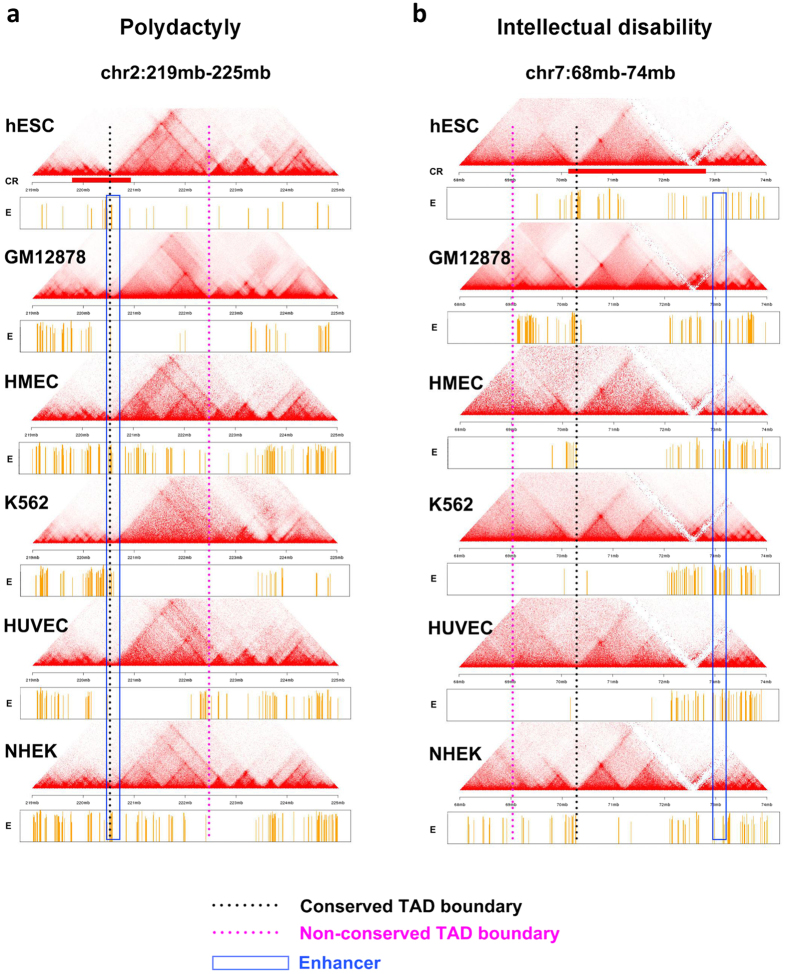
Figure 5. Differences and conservation of TADs and enhancers among cell types.
(a) The contact matrix and enhancers near a CR associated with polydactyly in six cell lines. The blue box indicates the enhancer region that contributes to the Enhancer score. The black dotted line is the TAD boundary that contributes to the Insulation score. (b) Similar plot to a for a CR associated with intellectual disability.

