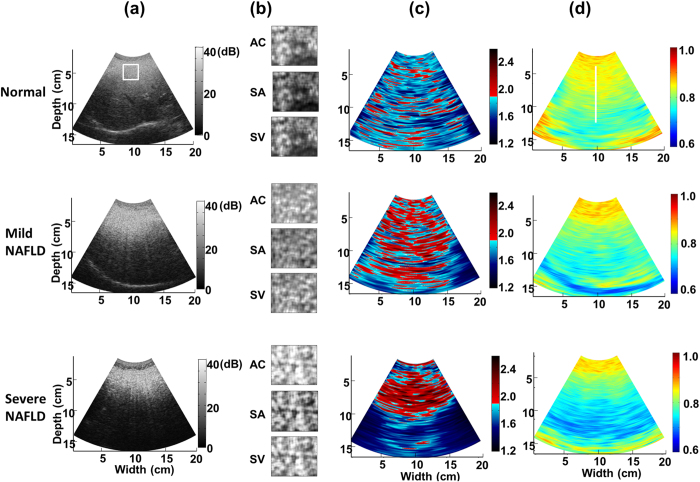
Figure 2.
Different types of images of a normal liver and livers with mild and severe NAFLD: (a) ultrasound B-mode images, (b) texture-feature images, (c) ultrasound signal-to-noise ratio (SNR) images, and (d) ultrasound center-frequency downshift (CFDS) images. The white square and white line delineating the region of interest were manually traced by the physician. AC: autocorrelation; SA: sum average; SV: sum variance.

