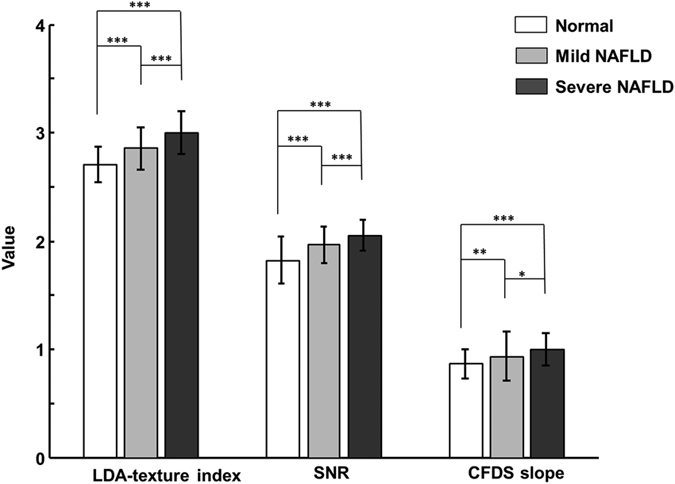
Figure 3. Mean and standard-deviation values of the linear discriminant analysis (LDA)-texture index, SNR, and CFDS slope for the normal, mild-NAFLD, and severe-NAFLD livers.

*p < 0.05; **p < 0.01; ***p < 0.001. Data were assessed by an analysis of variance and trend test.
