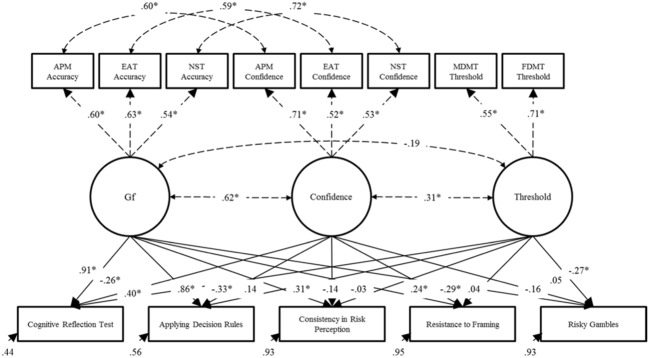
FIGURE 4.
Results of the final structural equation model described in Step 2. Dashed lines represent fixed parameters whose values and significance levels were determined in Step 1 of the model. ∗p < 0.05. APM, Raven’s Advanced Progressive Matrices; EAT, Esoteric Analogists Test; NST, Number Series Test; MDMT, Medical Decision-Making Test; FDMT, Financial Decision-Making Test.

