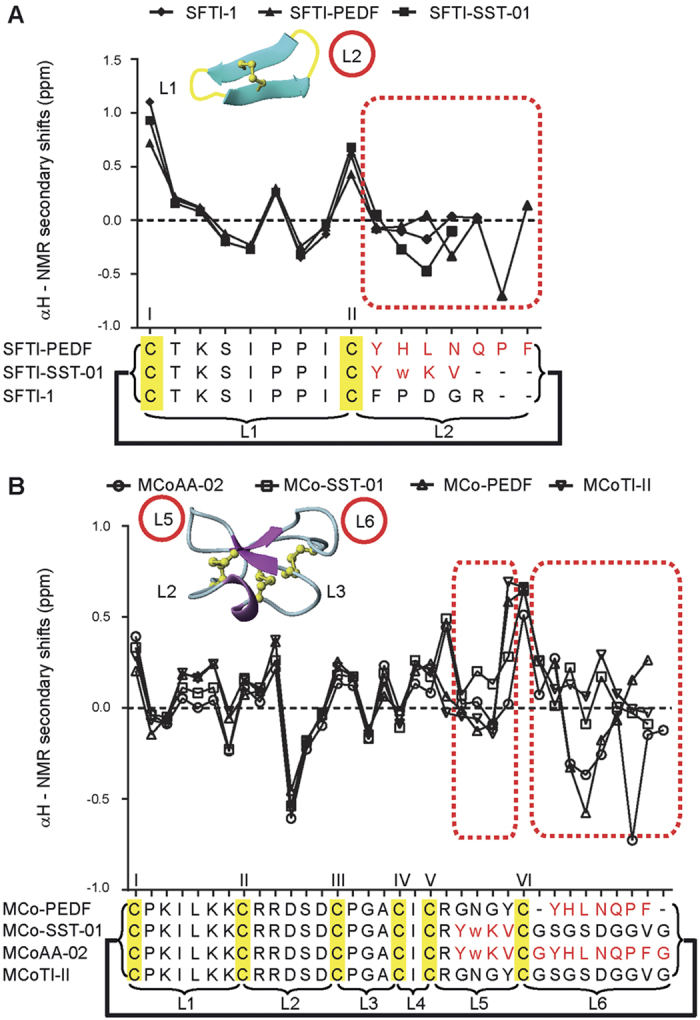
Figure 3. Structural analysis using NMR.

(A) Comparison of SFTI-1 αH secondary shifts. (B) Comparison of MCoTI-II αH secondary shifts. All 2D NMR spectra were recorded at 298 K. All anti-angiogenic sequences are written in red and the regions for comparing native and grafted sequence are outlined by red dotted boxes. Disulfide bond connectivity is highlighted in yellow, and bold lines are used represent the cyclic nature of the peptides. Each cysteine is labeled with a Roman numeral and each loop is represented with the letter ‘L’. The loop of insertion of an anti-angiogenic sequence is circled in red for both SFTI-1 and MCoTI-II structures. All spectra were assigned using CCPNMR46 and each of the amino acid spin systems were specifically assigned based on Wuthrich et al.47. The αH secondary shifts were analyzed by subtracting the random coil 1H NMR chemical shifts of Wishart et al.48 from the experimental αH chemical shifts. The 3D molecular structure of SFTI-1 and MCoTI-II were illustrated using MOLMOL49.
