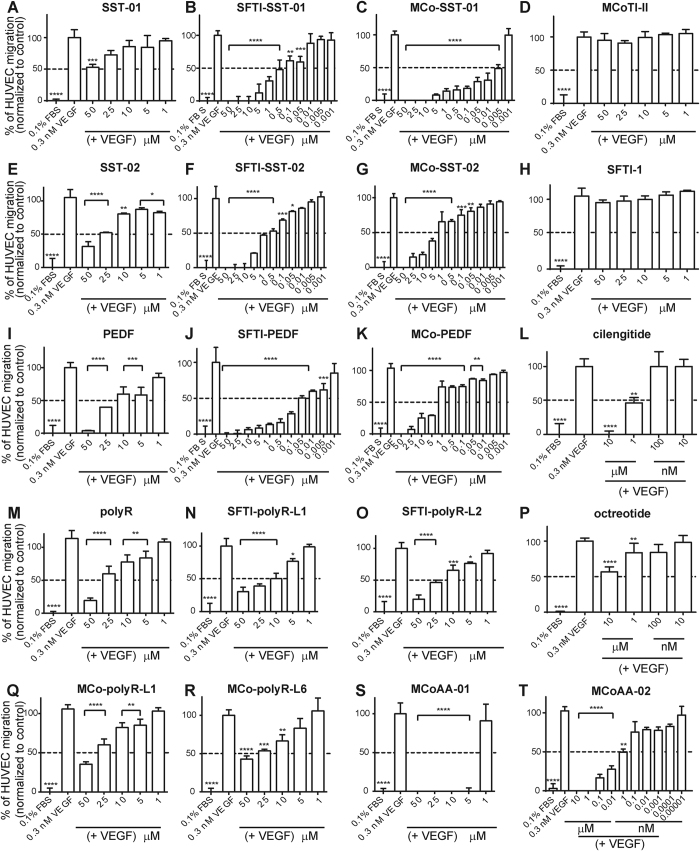
Figure 5. Cell migration on VEGF-mediated HUVECs.
The percentage of HUVEC migration was analyzed using Prism Version 6 (GraphPad). (A–T) VEGF was used as a positive control with 100% HUVEC migration. All peptides were tested at concentrations ranging from 0.001–50 μM except for cilengitide and octreotide, which were tested in 10-fold dilutions from 10 μM. Peptides were added in the presence of 0.3 nM VEGF (bottom chamber). Data are shown as mean ± SD (n ≥ 3). Data were normalized to the mean VEGF control. P-values are represented as follows: ****p ≤ 0.0001, ***p ≤ 0.001, **p ≤ 0.01, and *p ≤ 0.05. A one-way ANOVA with Dunnett’s post-test using a multiple comparison test was used for statistical analysis.

