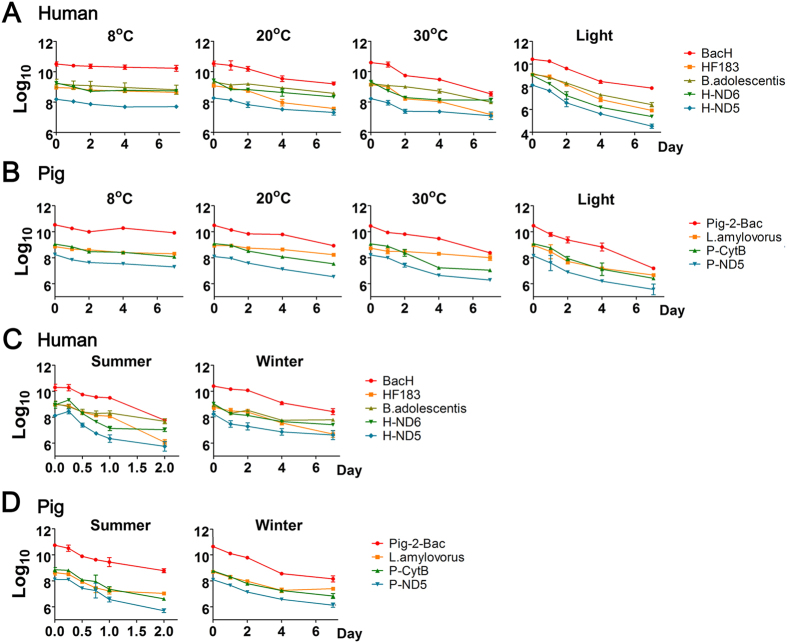
Figure 2. Decay curves of the DNA markers under different conditions.
(A) The human-associated markers in the laboratory microcosm; (B) The pig-associated markers in the laboratory microcosm; (C) The human-associated markers in the field microcosm; (D) The pig-associated markers in the field microcosm. The data are shown as log10 copies/L water.

